Netstat Visualization with Neo4j
2019-11-16
Neo4j makes it possible create nodes, describe relationships between the nodes, and query the database. It visualizes the output and you can spot patterns easily.
This project visualizes the information from netstat files collected on multiple nodes.
I got the idea on a security conference while talking to multiple security vendors, and after a training for Maltego.
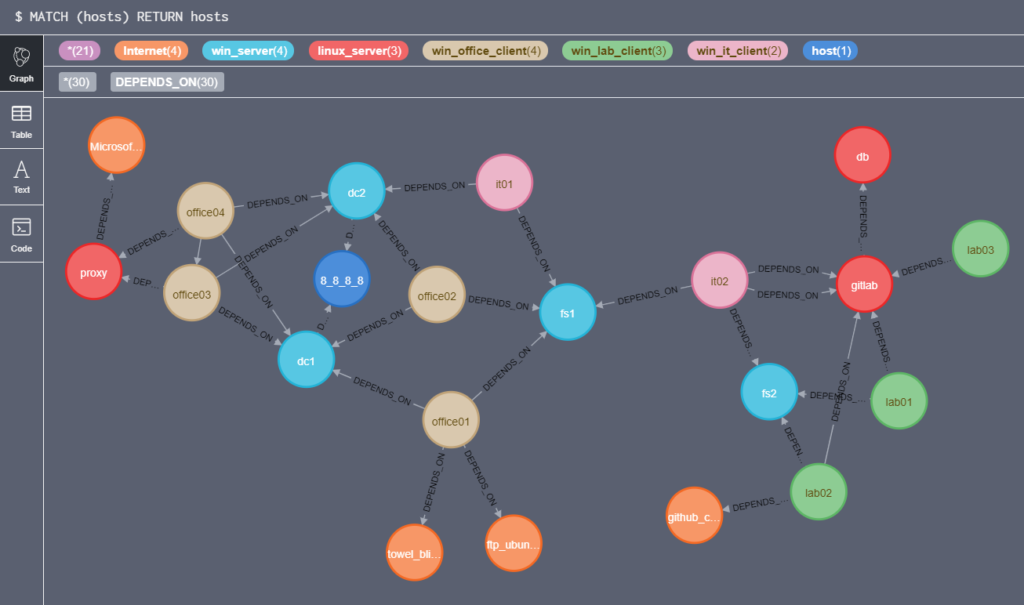
Run “netstat -an” on multiple hosts and draw a graph. Neo4j makes it easy to search for connections between ranges, can show you the usage of protocols, can can help you to easily identify issues.